
The Phyling application
Included with the Maxi-Hub
The platform that analyzes all your data at every training session.
How It Works
Flexibility
We define together the data and indicators to be recorded and calculated.
Visualization
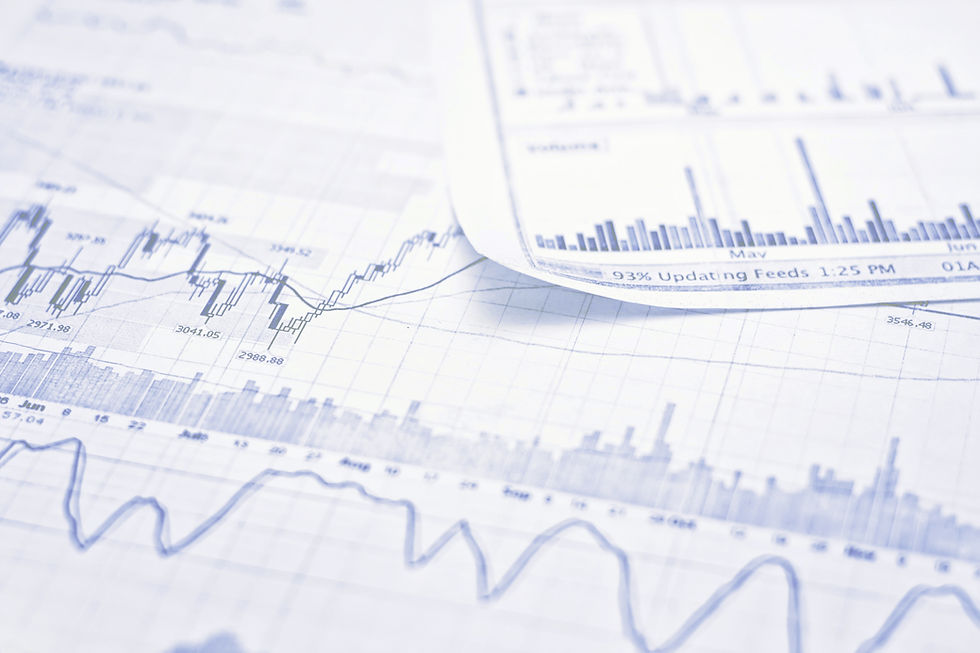
View your athletes' data in real-time, on the field, on your smartphone, tablet or computer.
Analysis
The platform analyzes data and generates personalized reports for each athlete after every session.
Tracking
Refine the planning of your sessions and the long-term management of your athletes.


Real-time Data Visualization
During training, get the information you need directly on your smartphone, tablet, or computer. You can even view multiple indicators simultaneously.
Automatic Data Collection
After each exercise, your data is automatically recorded, segmented, and organized within the application. You can quickly visualize the data you are interested in.
The values and statistics of the key indicators are also visible.


Analysis of Custom Indicators
Track each athlete's progress week by week with customized indicators tailored to your training needs (speed, strength, acceleration, power, cadence, etc.).
Customized reports can also be downloaded to enhance session analysis.